- 25 Jan 2024
- Print
- DarkLight
- PDF
Managing the Reporting Dashboard
- Updated on 25 Jan 2024
- Print
- DarkLight
- PDF
The Reporting Dashboard provides additional visibility into the performance of your programs and provides a high-level overview of key performance metrics. GRIN visualizes these metrics in different metrics that you can enable, filter, and organize to your needs.
How to do it
You can access your dashboard from Reporting > Dashboard. There are a few ways you can customize your dashboard. You can learn about each method in this article. They are:
- Enabling widgets
- Filtering data
- Changing chart views
Enabling widgets
You can add or remove widgets at any time so you only see the ones you need. To do so:
- Select the Settings button.
- Toggle each widget as needed. You can also select a different currency if you use multiple currencies in your account.
- Select Save.
Filtering data
You can filter your dashboard to only display the data you want to see by doing the following:
- Select Filters.
- Choose the filters you want to use.
- Select Apply.
Your filters will be applied to your dashboard. You can return to your Filters to update them, or select Clear All to remove all of them from your metrics.
Changing chart views
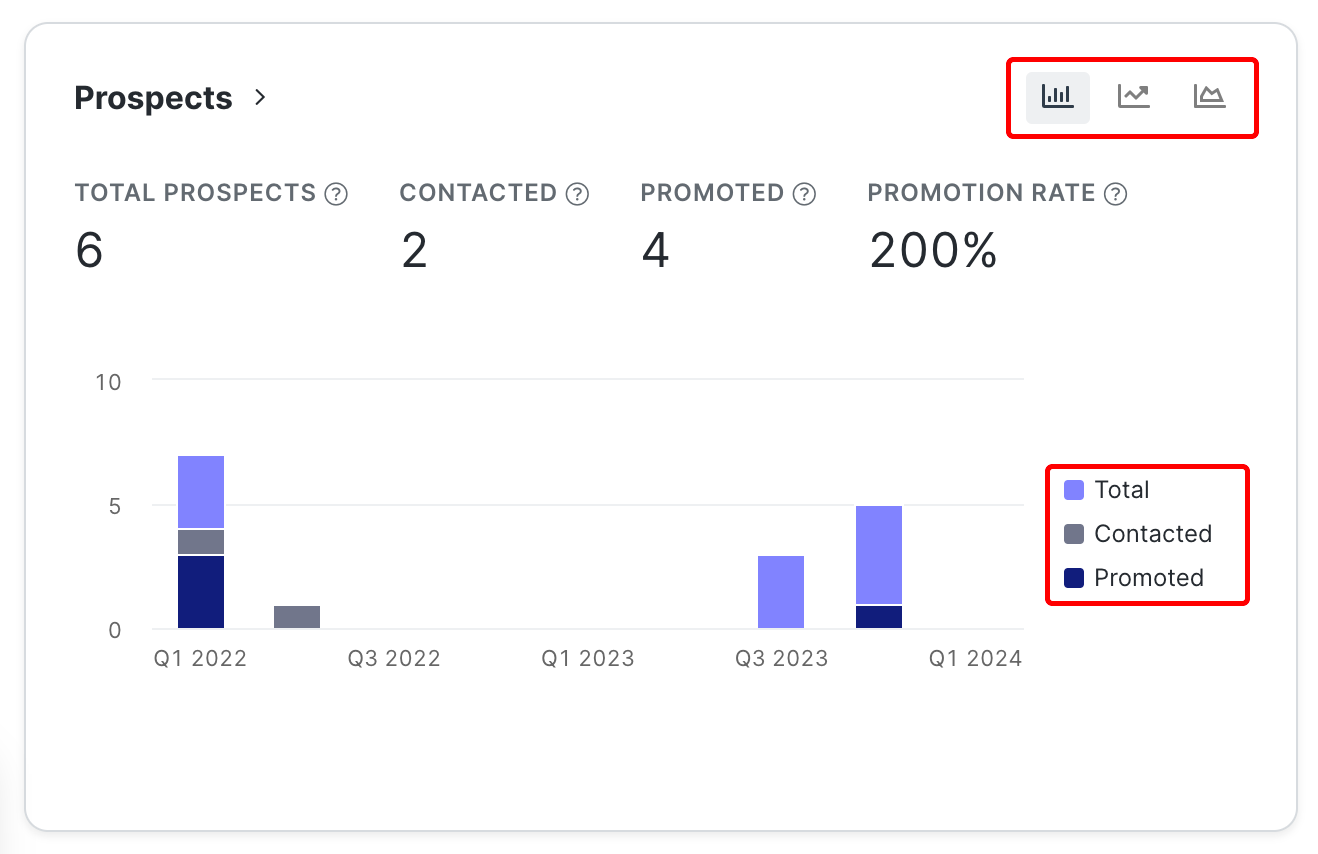
You can change the chart view on certain widgets. This lets you further customize what data you want to see on your dashboard. There are two ways to do it:
- Changing the chart type: Select a chart where available to switch the kind of chart you're looking at.
- Filtering data: Select an option in the legend to add or remove it from the data that's displayed in the chart.
 Charts that can be changed will appear with the different chart types and a legend.
