- 15 Nov 2024
- Print
- DarkLight
- PDF
Managing Your Activation's Reporting
- Updated on 15 Nov 2024
- Print
- DarkLight
- PDF
Your Activation's Reporting tab is a great place to see valuable insights about your Activation in one place as well as export them for later use. This tab has modules that not only show your Activation's current metrics but update live as new information comes in. Be sure to take advantage of Reporting often to learn how your Activation is performing and repurpose those metrics!
What You'll Need
- An existing Activationwith the following included to display their stats:
- Conversions: Enables the Activation's revenue, conversions, and revenue ROI metrics
- Activated creators: Top-performing creators display in the Creator Performance module
- Delivered content: Top-performing content display in the Content Performance module
How to Do It
To get started, navigate to Program > Activations > Your Activation > Reporting. This will open the Reporting tab’s Overview page with different modules tracking your Activation's performance, as well as Filters you can use to filter the Key Performance Indicators, Creator Performance, and Content Performance modules. You can learn more about each module in this article.
Monthly Reports
The Monthly Reports section lets you generate an all-in-one report for your Activation by month. To view one, select a month from the dropdown menu, then select View Report.
 Select a month to generate a report.
Your report will appear on a new page. You can quickly swap between different monthly reports with the dropdown in the top right corner, as well as Export the current report as a PDF.

Each report has the following sections that can appear as long as there’s relevant data for them:
- Content: View content-related statistics and their comparisons to previous months, including:
- Active creators: The number of creators that produced content within the month
- Content delivered: The number of individual pieces of content that were delivered within the month
- Content highlights: A summary of the top-performing pieces of content for that month. You can swap between different social networks if available to view content performance for each one.
- Content breakdown: A summary of the types of content that were delivered across which social networks for the month
- Engagement: View engagement-related statistics and their comparisons to previous months, including:
- IMV (Influencer media value): The estimated media value for the content posted by your creators for that month.
- Total engagements: The sum of all engagements on your content for that month. See the engagement breakdown for details on the types of engagements that were generated.
- Impressions: The number of times the content was viewed.
- Engagement comparison: Compares this month’s total engagements week by week against last month’s engagements.
- Engagement breakdown: A summary of the types of engagements that were gathered across which social networks for the month.
- Conversions: View conversion-related statistics and their comparisons to previous months, including:
- Conversions: Displays the number of link and code conversions for that month.
- Revenue: Displays the amount of revenue generated by link and code conversions for that month.
- Unique site visits: Displays the number of unique site visits from creators’ affiliate links for that month.
- Average order value: Displays the average value of orders placed through a creator’s link or with a discount code for that month.
- Conversion comparison: Compares this month’s total conversions week by week against last month’s conversions.
- Top average order value: Displays the five highest average orders for the month and which creators generated each order.
- Top converters: Displays the top converting creators, their link or discount code, and how much they generated that month.
Key Performance Indicators (KPIs)
This section displays various metrics about your Activation. It is a good way to assess how your Activation Activation is performing at a glance. You can also select the Export button to download a CSV file of your KPIs. Any filters you've applied to will be reflected in your CSV file.
 Select the export button to download a CSV report of your KPIs.
Creator Performance
This section displays your top 10 performing creators in your Activation based on:
- Their influencer media value (IMV) or their revenue sum if you have conversion tracking enabled, and
- Their performance metrics
You can select Creator Performance to open a new table with detailed creator performance data.
.png) Select the Creator Performance heading to open the corresponding table.This table has similar tools as other tables in GRIN:
Select the Creator Performance heading to open the corresponding table.This table has similar tools as other tables in GRIN: - Filters: Choose various options to filter your results by.
- Views: Save your current filtered table as a saved view. You can have up to five saved views per table.
- Search: Enter keywords to find specific results.
- Columns: Choose different columns to display in your table.
Select the Overview linkat the top left of the table to return to your Reporting Overview page.
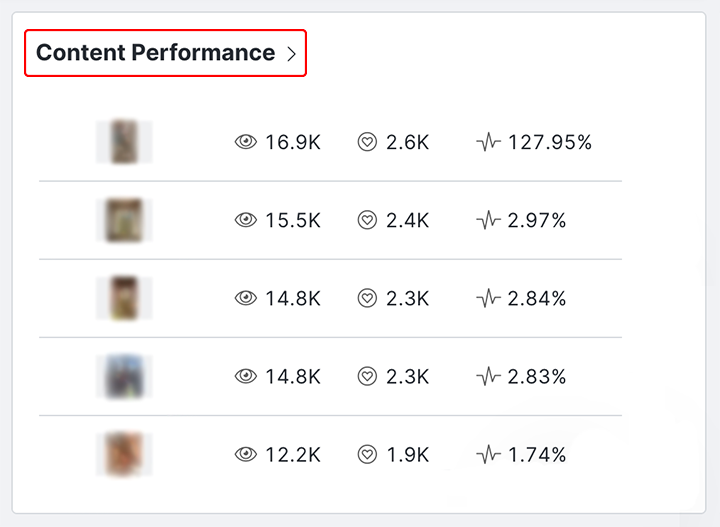
Content Performance
This section displays your creators' top 10 performing pieces of content in your Activation based on:
- Total impressions, and
- Performance metrics
You can select Content Performance to open a new table with detailed content performance data.
 Select the Content Performance heading to open the corresponding table.
This table has similar tools to other tables in GRIN:
- Filters: Choose various options to filter your results by.
- Views: Save your current filtered table as a saved view. You can have up to five saved views per table.
- Search: Enter keywords to find specific results.
- Columns: Choose different columns to display in your table.
Select the Overview link at the top left of the table to return to your Reporting Overview page.
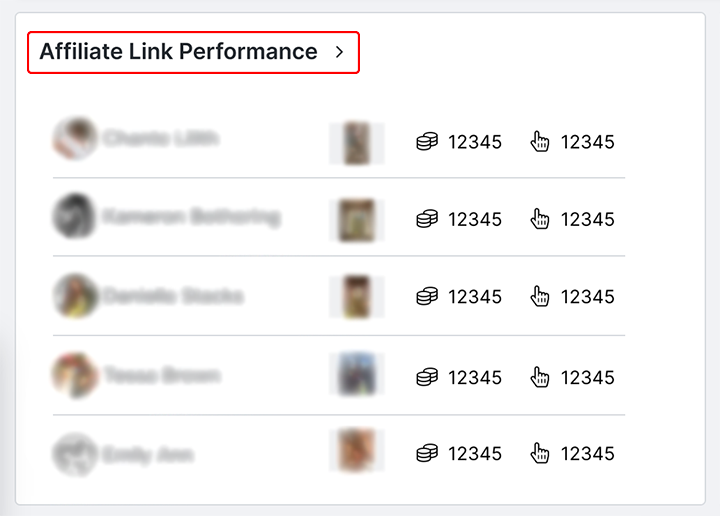
Affiliate Link Performance
This section displays your top 10 performing affiliate links associated with the Activation based on:
- The number of visits on that link, and
- The number of conversions generated by that link
Keep in mind that this section measures each individual link’s performance rather than the assigned creator’s performance. This means that if a creator has multiple affiliate links, then the creator may appear multiple times in this section if each of their links is performing very well.
You can select Affiliate Link Performance to open a new table with detailed affiliate link performance data.
 Select the Affiliate link performance heading to open the corresponding table.This table has similar tools as other tables in GRIN:
 - Filters: Choose various options to filter your results by.
- Views: Save your current filtered table as a saved view. You can have up to five saved views per table.
- Search: Enter keywords to find specific results.
- Columns: Choose different columns to display in your table.
Select the Overview link at the top left of the table to return to your Reporting Overview page.
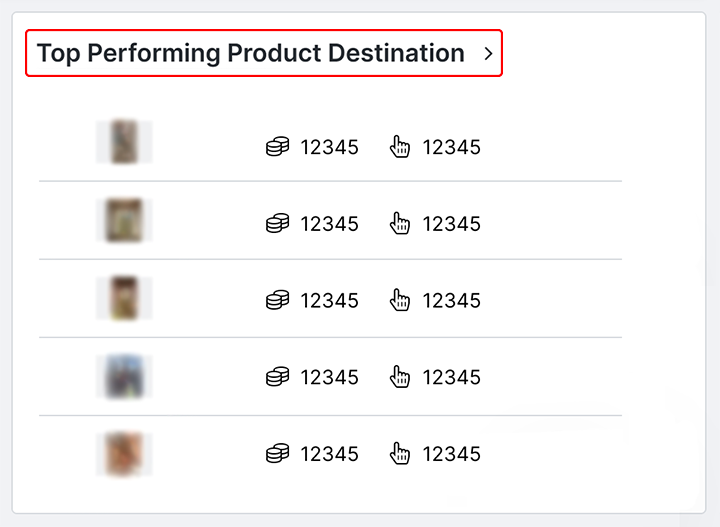
Top-Performing Product Destination
This section displays your top 10 performing affiliate link destinations across all affiliate links assigned to creators in the Activation based on:
- The number of visits to that destination, and
- The number of conversions generated by that destination
In other words, if your Activation has multiple affiliate links that direct people to the same place, then this section will show you which destination is the highest-performing one.
You can select Top Performing Product Destination to open a new table with detailed product destination performance data.
 Select the Top performing product destination heading to open the corresponding table.
This table has similar tools as other tables in GRIN:
- Filters: Choose various options to filter your results by.
- Views: Save your current filtered table as a saved view. You can have up to five saved views per table.
- Search: Enter keywords to find specific results.
- Columns: Choose different columns to display in your table.
Select the Overview link at the top left of the table to return to your Reporting Overview page.

