Understanding Activation Benchmarking
- 30 Aug 2024
- Print
- DarkLight
- PDF
Understanding Activation Benchmarking
- Updated on 30 Aug 2024
- Print
- DarkLight
- PDF
Article summary
Did you find this summary helpful?
Thank you for your feedback
Once you’ve launched your Activation, you can check how you’re progressing with the Benchmarking tab. This tab compares your current Activation’s performance with other similar companies to yours. GRIN uses real data from some of our most successful customers to calculate benchmarking breakpoints so you can learn from the best!
You can learn more about what’s available on the Benchmarking tab in this article.
Note
Activation Benchmarking is currently in beta, meaning that we need feedback from users (you!) to make it better before it fully launches. Reach out to our Support team or your Account Manager to share your experience with the beta.
How to Do It
You can access this tab by navigating to Program > Activations > Your Activation > Benchmarking.
Setting Up Benchmarking
If it’s your first time accessing the Benchmarking tab, you’ll be asked a few questions about your brand so GRIN can find the best-fitting benchmarks for you.
- Select Start Benchmarking.
- Choose your company’s size and select Next.
- Choose your brand’s goals for creator marketing. If you’re not sure what goal you want yet, you can choose any of the options that appear for now and change it later.
Note
Benchmarking support for Increasing quality UGC is coming soon!
That’s it! Your Benchmarking tab will now load in performance metrics from some of our top performing customers and let you know how you’re doing. You can learn more about each section of the tab in the next section.
Understanding Benchmarking Metrics
The Benchmarking tab splits up available metrics into four sections. Each section has different benchmarks to track your Activation’s performance.
Benchmarking Details
The Benchmarking Details section tracks how far along your benchmarking period has progressed. There are three metrics in this section:
- Activation Goal: This is the goal you chose while setting up Benchmarking.
- Benchmarking Period: The timeframe that GRIN benchmarks your performance against other top-performing brands. Depending on the type of your Activation, the timeframe displayed will be different. This can be changed from an Activation’s Settings > Basic Details.
- Ongoing: 90 days starting from when the Activation was first created.
- Scheduled: The number of days from your start to end date.
- Time Elapsed: The progress so far into the benchmarking period.
Your Target for This Benchmarking Period
Your target for this benchmarking period displays the primary metric for that period. This target is different depending on the goal you selected. This can be changed from an Activation’s Settings > Basic Details.
| Goal | Target metric | Description |
|---|---|---|
| Increasing brand awareness | Impressions | The number of times creator content in this Activation was seen by audiences. |
| Generating revenue | Revenue | The amount of money that’s been made from conversions on the Activation's affiliate links or discount codes. |
Key success metrics
Key success metrics are additional metrics that you can track your Activation by based on your selected goal. These metrics are directly related to your target metric. You can see all the metrics that can appear in the following table.
| Goal | Key success metric | Description |
|---|---|---|
| Increasing brand awareness | Engagement rate | The rate that audiences engaged with content each time it was viewed. Calculated as engagements ÷ impressions. A like, comment, share, reply, tap forward, tap back, tap away, and an exit are all considered an engagement. |
| Tasks completed | The number of tasks creators have completed in the Activation. | |
| Generating revenue | Links clicked | The number of times an affiliate link has been opened. |
| Number of conversions | The number of purchases directly made with an affiliate link or discount code from the Activation. |
These metrics are displayed with a maximum and minimum bar. Each bar is marked with a common range and median for the metric, which are based on other brands similar to yours that have succeeded in GRIN. You can see how you measure up to these by seeing how far your bar is filled. If it’s above the common range, then you’re doing better than average! If you’re below the range, then you likely have room to improve. Keep an eye on these measurements to track how your Activation is progressing.

Activity Metrics
Activity metrics track how your creators are participating within the Activation. These metrics are the same no matter what goal you selected for the Activation.
- Proposals Accepted: Number of proposals accepted into the Activation, including proposals you accept from creators and those you accept on behalf of creators.
- Proposals Completed: Number of proposals completed by creators. A proposal is considered complete once the creator finishes all of their assigned tasks or if the Activation's content tracking end date has passed.
- Proposals Submitted: Number of proposals submitted by creators to the Activation.
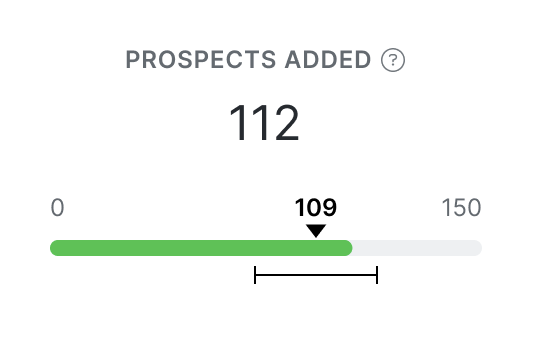
- Prospects Added: Number of prospects added to the Activation.
These metrics are displayed with a maximum and minimum bar. Each bar is marked with a common range and median for the metric, which are based on other brands similar to yours that have succeeded in GRIN. You can see how you measure up to these by seeing how far your bar is filled. If it’s above the common range, then you’re doing better than average! If you’re below the range, then you likely have room to improve. Keep an eye on these measurements to track how your Activation is progressing.
Was this article helpful?